|
Home Graphing and Writing Linear Functions SOLVING EQUATIONS INVOLVING RATIONAL EXPONENTS Linear Equations and Graphing Systems of Linear Equations Solving Polynomial Equations Matrix Equations and Solving Systems of Linear Equations Introduction Part II and Solving Equations Linear Algebra Graphing Linear Inequalities Using Augmented Matrices to Solve Systems of Linear Equations Solving Linear Inequalities Solution of the Equations Linear Equations Annotated Bibliography of Linear Algebra Books Write Linear Equations in Standard Form Graphing Linear Inequalities Introduction to Linear Algebra for Engineers Solving Quadratic Equations THE HISTORY OF SOLVING QUADRATIC EQUATIONS Systems of Linear Equations Review for First Order Differential Equations Systems of Nonlinear Equations & their solutions LINEAR LEAST SQUARES FIT MAPPING METHOD FOR INFORMATION RETRIEVAL FROM NATURAL LANGUAGE TEXTS Quadratic Equations Syllabus for Differential Equations and Linear Alg Linear Equations and Matrices Solving Linear Equations Slope-intercept form of the equation Linear Equations DETAILED SOLUTIONS AND CONCEPTS QUADRATIC EQUATIONS Linear Equation Problems Systems of Differential Equations Linear Algebra Syllabus Quadratic Equations and Problem Solving LinearEquations The Slope-Intercept Form of the Equation Final Exam for Matrices and Linear Equations Linear Equations |
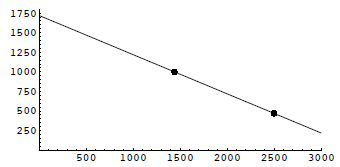
Linear Equations and Graphing• Linear Equations in two variables • Graphing Ax+By = C • Slope of a line • Special Forms of a linear equation • More applications The Price-demand equation again: d = 1720 − .50p. We can
Definition 1 A linear equation in two variables is
an equation Ax+By = C where A, B, and C are constants (A and B not both zero)
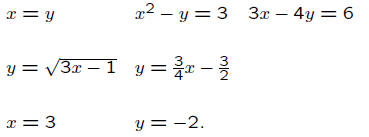
and Circle the LINEAR equations:
Do you think that all such linear equations, when graphed
will
The shape of the graph of a linear equation: Theorem 1 The graph of any equation of the form
Ax+By = C This theorem makes it very easy to graph a linear
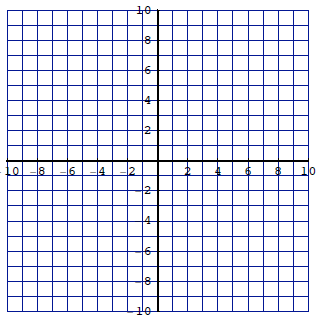
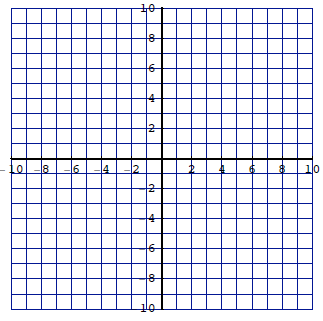
equation... Moral: Theorems are your friends. Two special cases: • Horizontal lines • Vertical lines Try graphing 4x − 3y = 12 by finding two easy solutions to
the
What about x = 3? x− and y− intercepts of an equation: Definition 2 In the graph of any equation of two
variables, the What do the coordinates of an x-intercept look like? What do the coordinates of a y-intercept look like? The intercepts of a linear equation are easier to locate
than the x- and y-intercepts of a linear equation: Find the x- and y- intercepts for 4x − 3y = 12. Find the x- and y-intercepts for 7x − .2y = 12. Could a linear equation have more than one x-intercept? Does a linear equation always have an x-intercept?
CAREFULL Intercepts for the Price-demand equation.
What are the p- and d-intercepts? What do they mean here?
|


 y =
c for some number c
 x = c
for some number c